Recruitment Metrics: 16 KPIs to Track (With Formulas and a Free Tracker)
16 recruitment metrics and KPIs with formulas — speed, funnel, quality and cost — plus agency KPIs, a screening-metrics dictionary, a reporting guide and a free tracker to build your baseline.
By Beatview Team · Published · Updated · 6 min read
Key takeaways
- A useful recruitment metric has a precise numerator, denominator and start/stop event, and an owner who can act on it.
- Track about a dozen metrics across speed, funnel, quality and cost; promote three or four to KPIs.
- Agencies should prioritise time to submit, submission-to-interview ratio and fill rate — the numbers clients judge them on.
- Use applications reviewed (not received) as the shortlist-rate denominator, and medians for every time metric.
- Build a four-week baseline on one role before changing anything; borrowed benchmarks are context, not targets.
Recruitment metrics are measurements of how well your hiring process works — how fast it moves, where candidates drop out, how much it costs and how good the hires turn out to be. The metrics worth tracking are the ones with a precise definition (a numerator, a denominator and the event that starts and stops the clock) and an owner who can act on them. Below are 16 recruitment metrics and KPIs with formulas, grouped into speed, funnel, quality and cost, plus the agency-specific ones, a screening-metrics dictionary, and a free tracker to start a baseline this week.
Recruitment metrics vs recruitment KPIs
A metric is anything you measure; a KPI (key performance indicator) is a metric you have chosen as a target because it reflects success. Most teams should track a dozen metrics and promote three or four to KPIs — for an agency, typically time to submit, submission-to-interview ratio and fill rate; for an in-house team, time to fill, offer acceptance rate and quality of hire.
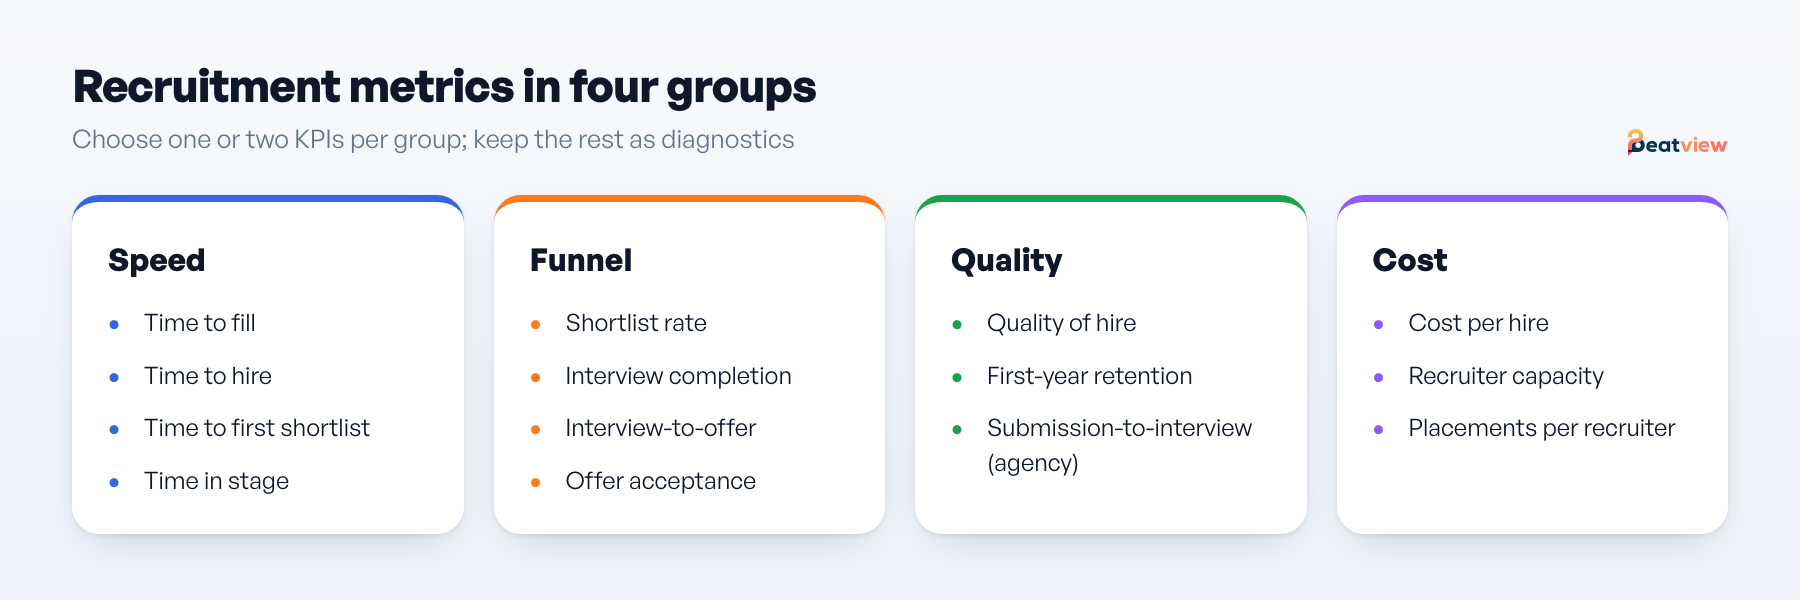
16 recruitment metrics with formulas
Speed metrics
| Metric | Formula | What it tells you |
|---|---|---|
| Time to fill | Offer accepted date − requisition opened date | How long the business waits for a hire. See time to fill. |
| Time to hire | Offer accepted date − date the hired candidate applied (or was sourced) | How fast your process moves a candidate. See how to reduce time to hire. |
| Time to first review | Median of (first recruiter action − application date) | Whether applications sit unread |
| Time to first shortlist | First shortlisted candidate date − role opened date | The earliest point a hiring manager can act |
| Time in stage | Median days candidates spend in each stage | Where waiting happens |
Funnel metrics
| Metric | Formula | What it tells you |
|---|---|---|
| Applications per role | Count of applications | Reach of the job ad and sourcing |
| Application completion rate | Applications submitted ÷ applications started | Whether the form is too long |
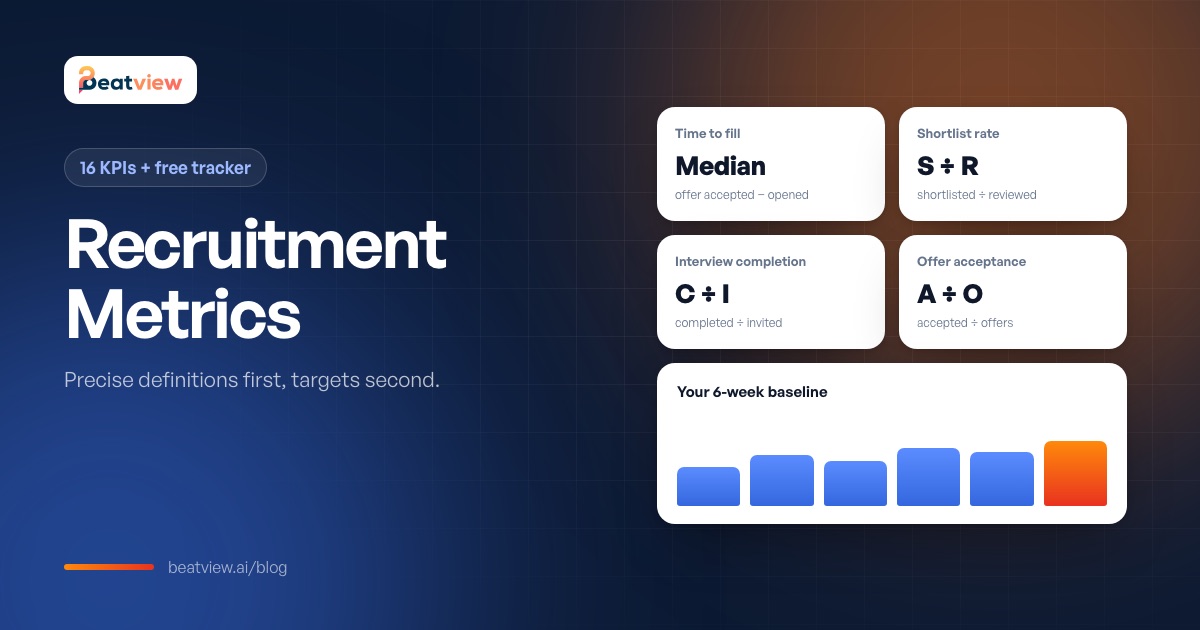
| Shortlist rate | Candidates shortlisted ÷ applications reviewed | How well sourcing matches the criteria |
| Interview completion rate | Interviews completed ÷ interviews invited | Candidate engagement at the first interview |
| Interview-to-offer ratio | Offers made ÷ candidates interviewed | Shortlist quality and interview calibration |
| Offer acceptance rate | Offers accepted ÷ offers made | Competitiveness of offers and candidate experience |
| Source of hire | Hires by channel ÷ total hires | Which channels produce hires, not just applicants |
Quality metrics
| Metric | Formula | What it tells you |
|---|---|---|
| Quality of hire | Average of agreed post-hire measures (e.g. manager rating at 90 days, performance rating, retention) | Whether the process selects people who succeed |
| First-year retention | Hires still employed after 12 months ÷ hires | Fit between the role as sold and the role as experienced |
Cost metrics
| Metric | Formula | What it tells you |
|---|---|---|
| Cost per hire | (Internal recruiting costs + external recruiting costs) ÷ number of hires | Efficiency of spend; the ANSI/SHRM cost-per-hire standard defines which costs to include |
| Recruiter capacity | Open roles (or hires) per recruiter | Whether workload is sustainable |
Recruitment agency KPIs
Agencies are judged by clients on submissions and placements, so a few metrics matter more than they do in-house:
| Agency KPI | Formula | Why clients care |
|---|---|---|
| Time to submit | First candidate submitted to client − role received | How fast the client sees real options |
| Submission-to-interview ratio | Client interviews ÷ candidates submitted | The clearest signal of shortlist quality |
| Interview-to-placement ratio | Placements ÷ client interviews | How well candidates are prepared and matched |
| Fill rate | Roles filled ÷ roles taken on | Delivery reliability |
| Placements per recruiter | Placements ÷ recruiters (per period) | Desk productivity |
Screening metrics dictionary
Most dashboards fail because nobody agreed what the numbers mean. For the screening stage, define each metric precisely so two people count the same thing the same way:
| Metric | Numerator ÷ denominator | Event source | Owner |
|---|---|---|---|
| Parsing failure rate | Applications with no usable resume ÷ applications received | Resume parsing status | Recruiter |
| Duplicate rate | Repeat applications to the same role ÷ applications received | Same email on the same role | Recruiter |
| Time to first review | Median of (first stage change − application created) | Pipeline stage change | Recruiter |
| Shortlist rate | Shortlisted ÷ applications reviewed | Stage change into shortlist | Recruiter |
| Interview completion rate | Completed ÷ invited | Invitation sent; interview completed | Recruiter |
| Client submission rate | Sent to client ÷ shortlisted | Share or handoff record | Account owner |
Two counting rules prevent most arguments: use applications reviewed, not received, as the denominator for shortlist rate — otherwise a sourcing spike looks like a screening problem — and use medians for every time metric, because one stalled candidate ruins an average.
Recruitment metrics dashboard: what to report to whom
| Audience | Report | Frequency |
|---|---|---|
| Hiring manager or client | Time to first shortlist, submissions, interviews booked, next steps | Weekly per role |
| Recruitment lead | Time in stage, interview completion rate, recruiter capacity, offer acceptance | Weekly |
| Leadership | Time to fill, cost per hire, quality of hire, first-year retention | Monthly or quarterly |
How to start measuring in one week
- Pick one role (and one client, for agencies). Do not instrument everything at once.
- Copy the tracker CSV and fill one row per week.
- Agree the definitions above with everyone who enters data.
- Record any threshold or rule you use, and why, next to the results.
- After four weeks you have a baseline. Change one thing, then compare.
Be wary of borrowed benchmarks. Figures such as "resumes screened per hour" or a "good" shortlist rate depend on your sourcing mix, roles and clients. The one external benchmark widely cited — SHRM's time-to-fill data, which puts the median at roughly a month and a half — is useful context, not a target. Measure your own before-and-after on one role; that number you can defend.
Which metrics Beatview records
Beatview's candidate event log records when applications arrive, when stage rules send interview invitations, when interviews are completed and when candidates change stage — the timestamps behind time to first review, interview completion rate and time to first shortlist. Beatview does not include a built-in analytics dashboard for these metrics, so record these events in your own tracker. See recruitment automation.
Frequently asked questions
What are the most important recruitment metrics?
For most teams: time to fill, time to hire, shortlist rate, interview-to-offer ratio, offer acceptance rate, cost per hire and quality of hire. Agencies should add time to submit, submission-to-interview ratio and fill rate.
What is the difference between recruitment metrics and KPIs?
Metrics are anything you measure; KPIs are the few metrics you set targets for because they reflect success. Track many metrics, but manage to three or four KPIs.
How do you calculate cost per hire?
Add internal recruiting costs (for example recruiter time and tools) and external costs (advertising, agency fees, events), then divide by the number of hires in the same period. The ANSI/SHRM cost-per-hire standard lists which costs to include.
What is a good time to fill?
It depends on role and market. SHRM benchmarking puts the median at roughly a month and a half, but your own baseline by role type is a better target than any average.
How do you measure quality of hire?
Agree two or three post-hire measures in advance — such as the hiring manager’s 90-day rating, the first performance rating and 12-month retention — and average them for each hire and each source.